Electric vehicle total cost of ownership
Every Mile.
Every Rate.
Every Dollar.
Whether an electric vehicle (EV) costs less than gas or a hybrid depends on the price gap, the local electricity rate, gas prices, mileage and resale value. Drive Economics prices each line item and shows where the answer flips.
From the Model Y vs. RAV4 case study, including depreciation, Xcel EV Accelerate At Home and $4.51 gas.
The proposition
Same question.
24 different answers.
An EV usually costs more to buy and less to run. Whether the running savings catch up depends on things a national average hides: the utility’s rate design, the local gas price, state incentives, annual mileage and how fast the model loses value.
Across our 24 side-by-side case studies, the EV has the lower 5-year cost in 12, gas or a hybrid has the lower cost in 9, and 3 are within about $500. The differences run from $9,172 lower for a gas pickup in Nashville to $14,528 lower for an electric pickup in Boulder.
No automaker, dealer or utility sponsorship. Every assumption is published.
Five-year cost difference in every case study
EV minus gas or hybrid, as published. Light bars show the range across rate plans, charging habits or mileage. Click a row to open the case.
Swipe to see the full chart →
The tools
Run the numbers for a specific car and ZIP.
EV vs. Gas
Any electric vehicle against any gas or hybrid model across the full ownership period, priced to a ZIP code.
Compare → CalculatorEV Cost
The 5-year cost to own one EV: financing, electricity, insurance, maintenance, depreciation and incentives.
Calculate → Rate finderUtility Rates
What charging costs on each local rate plan, including time-of-use and EV-specific rates.
Find a rate → DatabaseIncentives & Rebates
State, utility and local EV and charger incentives by ZIP code, with current status.
Search → LibraryEV Specifications
Range, efficiency, price and U.S. availability for every EV in our library. Filter and sort.
Browse → LibraryAnalysis
Buying guides, utility rate analyses, managed charging and V2G, commercial charging and case studies.
Explore →Start with a question
The analysis, organized by decision.
Should this household buy an EV, a hybrid or gas?
Mileage, depreciation, luxury tiers, cold weather and multi-EV households.
3Charging at homeWhat will charging cost, and what does the house need?
Home vs. public fast charging, time-of-use patterns and panel capacity.
18Utility EV ratesWhich electricity rate fits an EV?
Rate analyses for 17 utilities in 10 states, plus a framework.
5Managed charging & V2GWill the utility pay to manage charging?
Smart charging rewards, demand response, VPP programs and vehicle-to-grid.
3Commercial chargingDoes a workplace, fleet or public charger pencil out?
Make-ready rebates, demand charges and returns for site hosts.
24Case studiesWhat does the math show in a specific city?
24 side-by-side EV vs. gas and hybrid comparisons with full 5-year math.
What’s included
Every line item, accounted for.
Many vehicle cost calculators come from automakers, dealers or advocacy groups. Gas-side tools often leave out home charging savings; EV-side tools often assume the best incentive and the cheapest off-peak rate.
Drive Economics uses gas prices from the U.S. Energy Information Administration (EIA), electricity rates from utility tariffs and the OpenEI rate database, and efficiency from the EPA. Read the methodology →
What you pay
- Purchase price and sales tax
- Financing and interest
- Fuel or electricity
- Routine maintenance and repairs
- Insurance
- Registration and EV fees
- Home charging install
- Depreciation
What comes back
- State and utility rebates
- Lower maintenance (EVs)
- Resale value
- Managed charging rewards
- Time-of-use savings
- Fuel cost avoidance
- Federal credit (ended 2025)
Ownership Economics family
Where the car meets the grid.

VPP Economics
Vehicle-to-grid: when a parked EV becomes a grid battery
Grid value in kW, 2026 programs and what they pay per vehicle.
Read →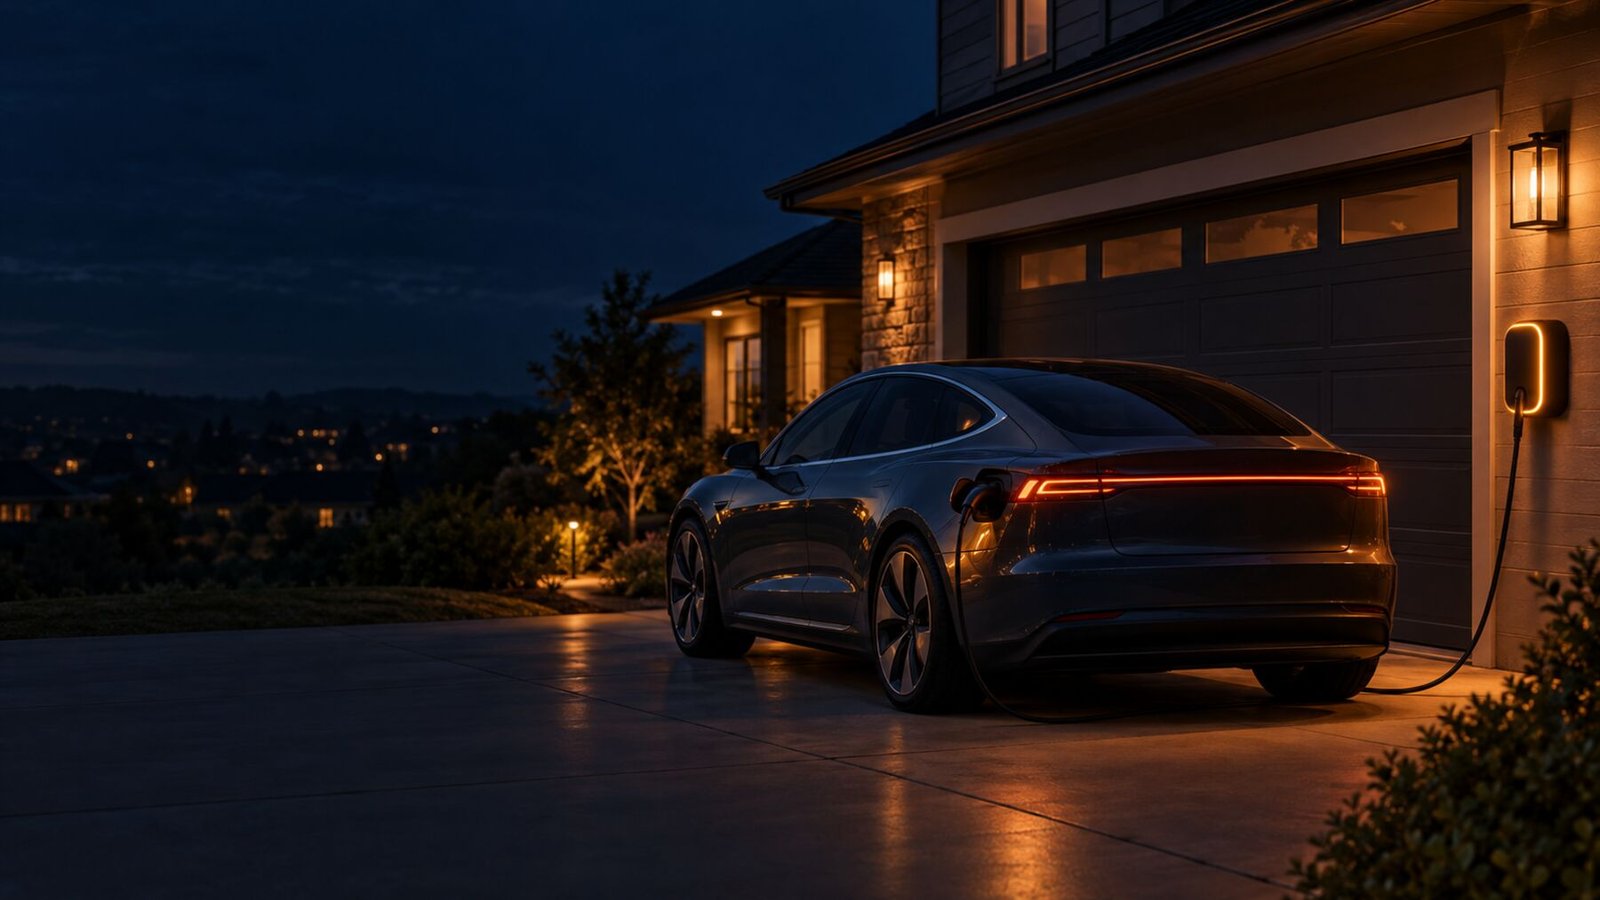
VPP Economics
EV managed charging as a grid asset
Where the value of a managed EV comes from and how much reaches drivers.
Read →
Battery Economics
Home battery economics
Backup, time-of-use savings and VPP earnings for home storage.
Visit →